Sound Quality Must Reconcile Objective Data and Subjective Evaluation.
It’s important to not make decisions based solely on subjective observations or abstract ratings. Just as important, it’s risky to make decisions based on charts showing results that cannot be reconciled by an independent jury. Objective data must be validated by subjective evaluation. That way, you can cost-effectively rank potential solutions or design options. In other words, you should see what you hear!
To highlight frequency and amplitude sensitivity, listen to the simple sound examples below. Example 1 is low-frequency; and Example 2 is high-frequency. All of the samples have the same amplitudes, but some sound louder than others.
Quantifying your product noise should never be a mystery. Let Phase1 Acoustics assist you in designing and developing your product to achieve the acoustic performance it deserves.
LOW-FREQUENCY BEATING
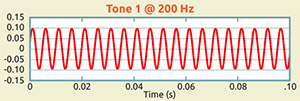
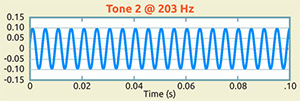
Subjectively, you hear a “beating” tone in a rotating product. This event is simulated by combining a tone at 200 Hz and another tone at 203 Hz.
Listen to the following two tones separately:
Tone 1 @ 200 Hz
Tone 2 @ 203 Hz
Now listen to the combined tones. Do you hear the “beating” phenomena?
Tones 1 and 2 combined
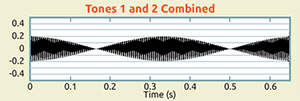
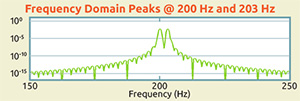
The graph below clearly shows two peaks at 200 Hz and 203 Hz, which explains the beating.
HIGH-FREQUENCY BEATING
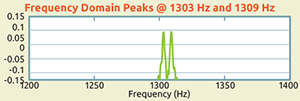
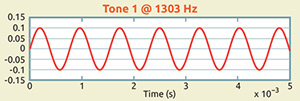
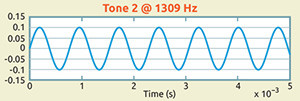
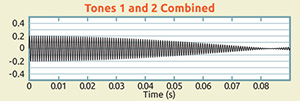
Subjectively, you hear a “beating” tone in a rotating product. This event is simulated by combining a tone at 1303 Hz and another tone at 1309 Hz.
Listen to the following two tones separately:
Tone 1 @ 1303 Hz
Tone 2 @ 1309 Hz
Now listen to the combined tones. Do you hear the “beating” phenomena?
Tones 1 and 2 combined)
The graph below clearly shows two peaks at 1303 Hz and 1309 Hz, which explains the beating.
